
Uncover chromatin
accessibility with
spatial precision.
Map open chromatin directly on tissue — no dissociation required. Connect regulatory programs to morphology and cell state on the same slide.
Methylation
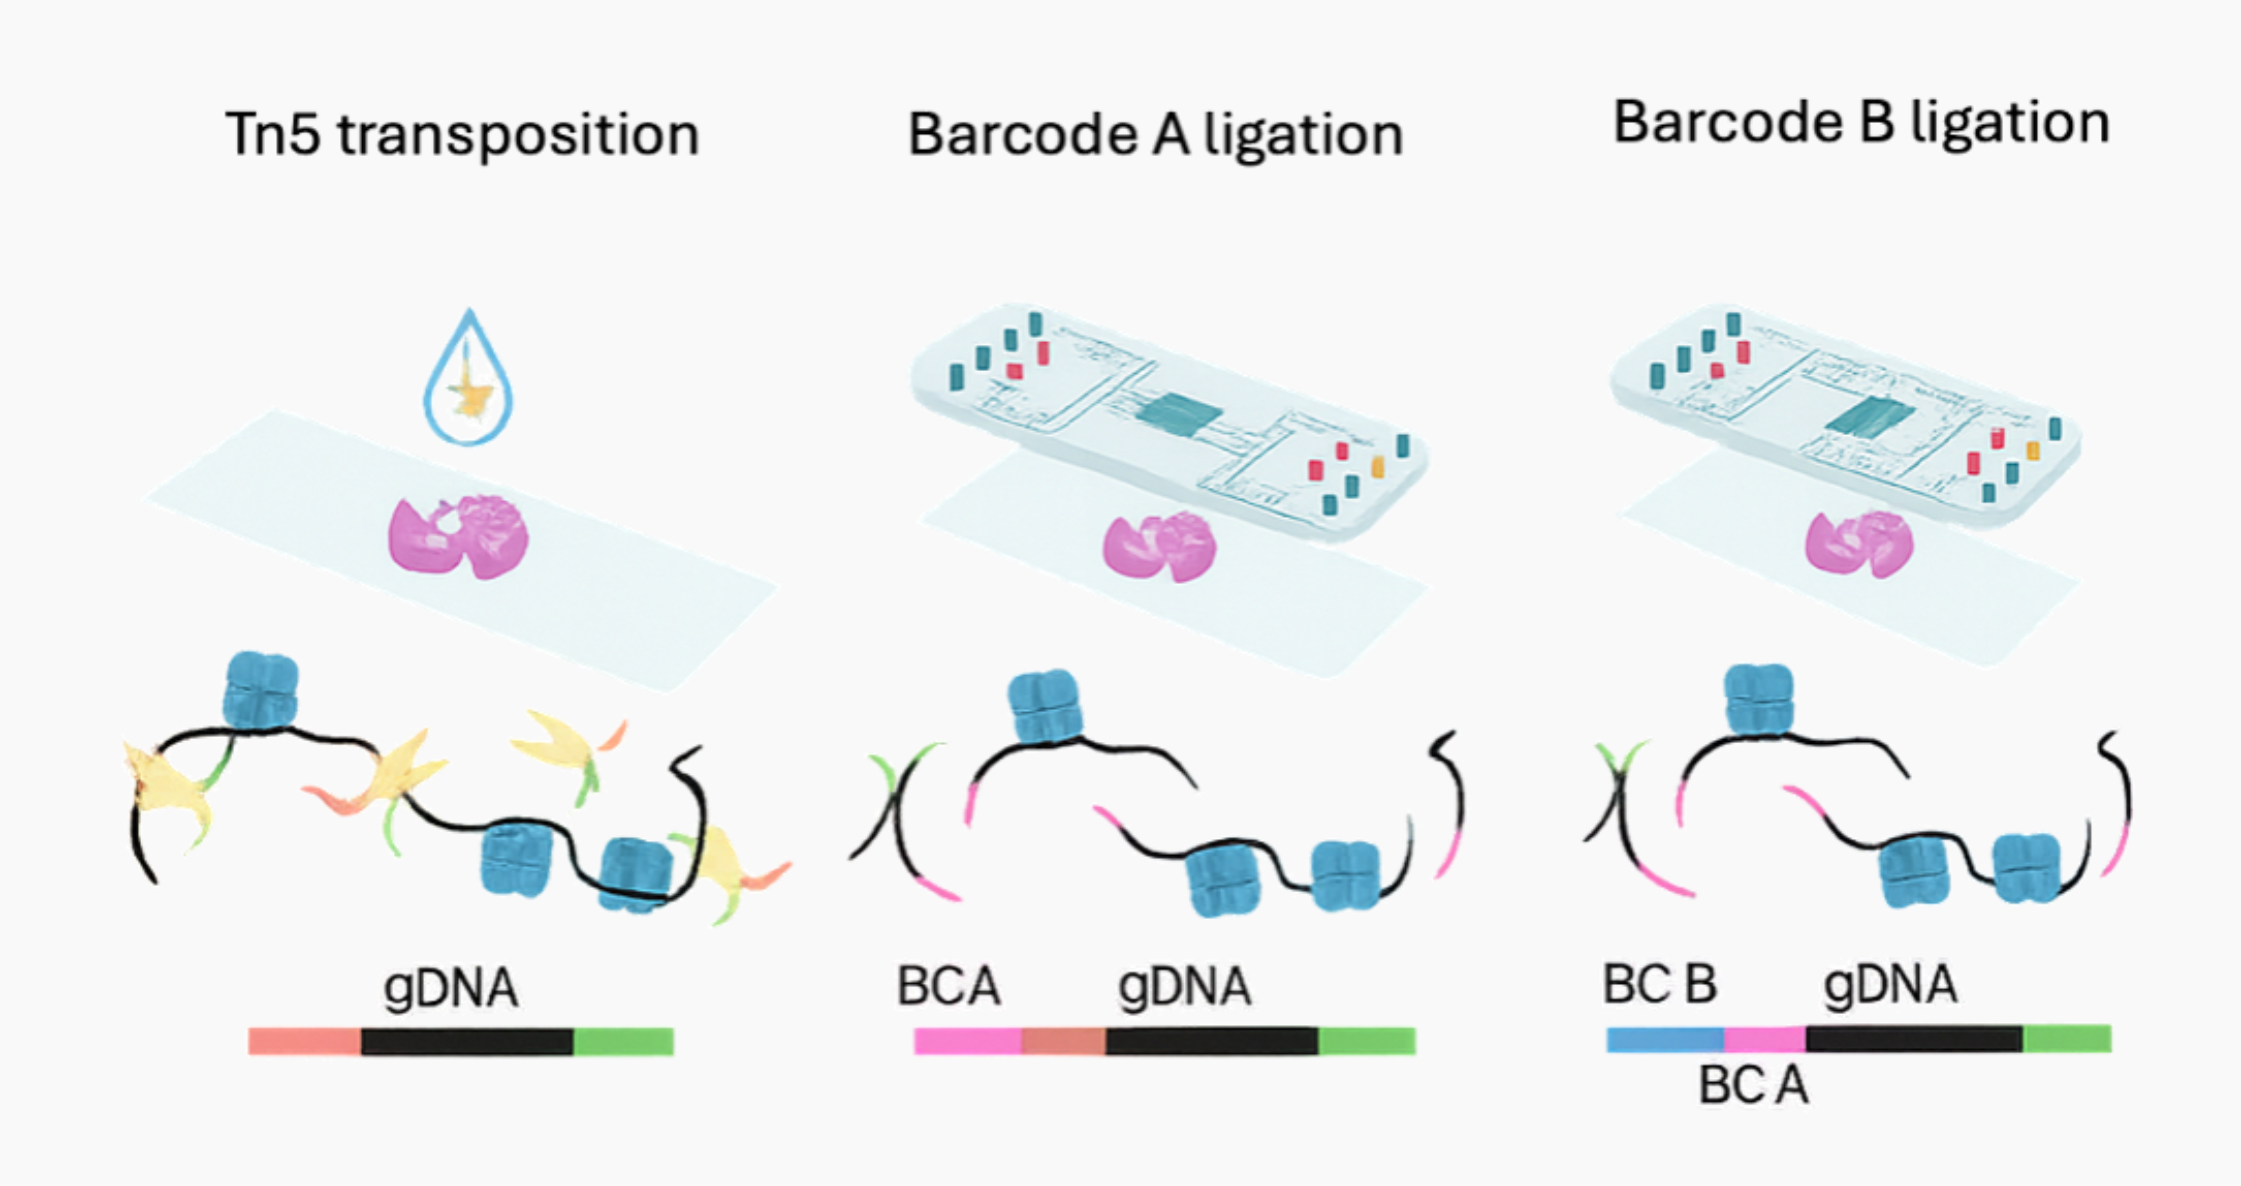
Spatial ATAC-seq for high-resolution chromatin accessibility
Preserve spatial organization while profiling chromatin accessibility across tissue sections. Connect accessibility to morphology, cell state, and regulatory programs — all on the same slide.
-
Whole-tissue context No dissociation required. Spatial organization is preserved so you can correlate accessibility with histology.
-
From peaks to programs Call peaks, quantify gene activity, score motifs and TF binding potential, and annotate neighborhoods and cell states in a single workflow.
-
Seamless co-analysis Designed to integrate with spatial RNA, spatial DNA methylation, or H&E for multi-omic interpretation and better target discovery.
-
FFPE support (new) Run challenging archival samples with an FFPE-ready workflow and analysis presets.
The methods and platform behind spatial ATAC-seq.
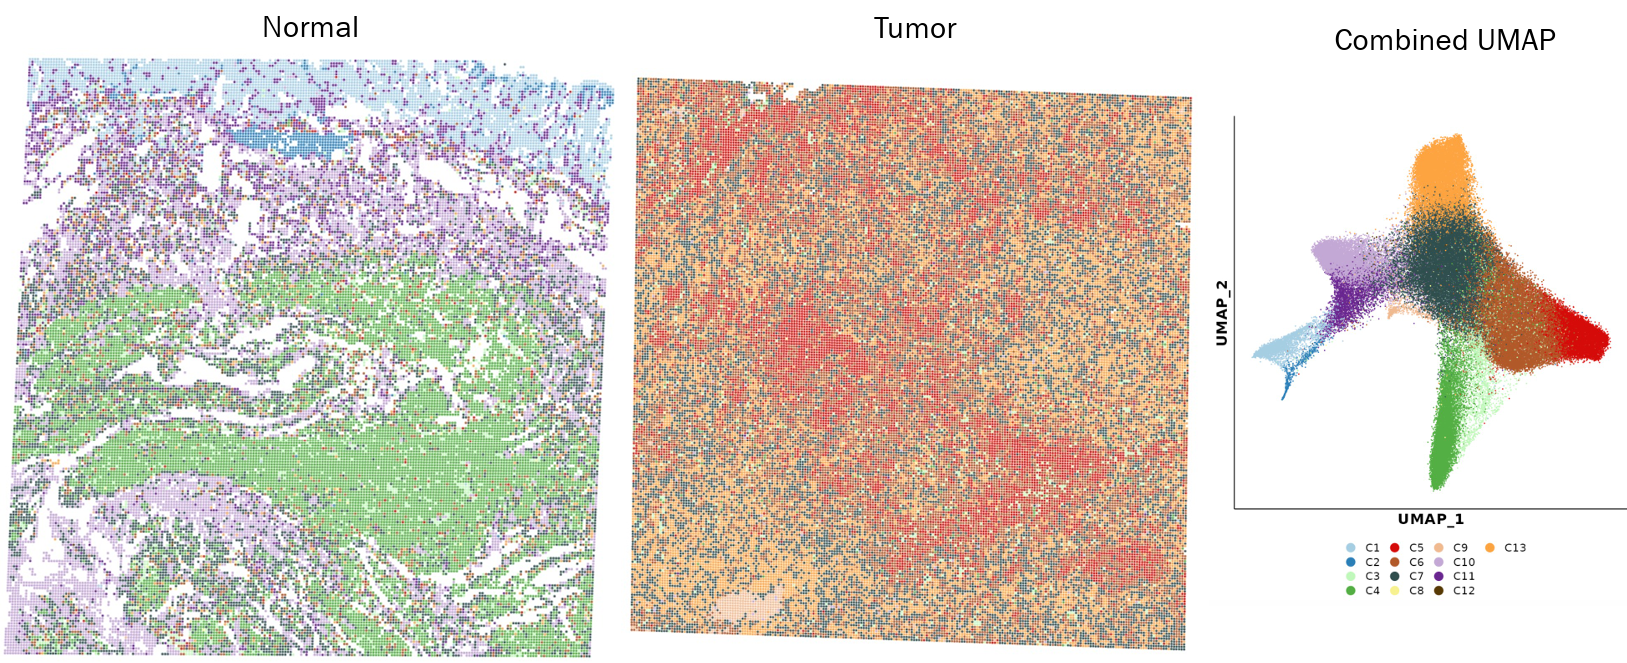
These publications showcase spatial ATAC-seq across fresh frozen and FFPE tissues, demonstrating how the assay maps chromatin accessibility within tissue architecture to reveal spatially organized cell states, regulatory programs, and disease-associated epigenetic changes.
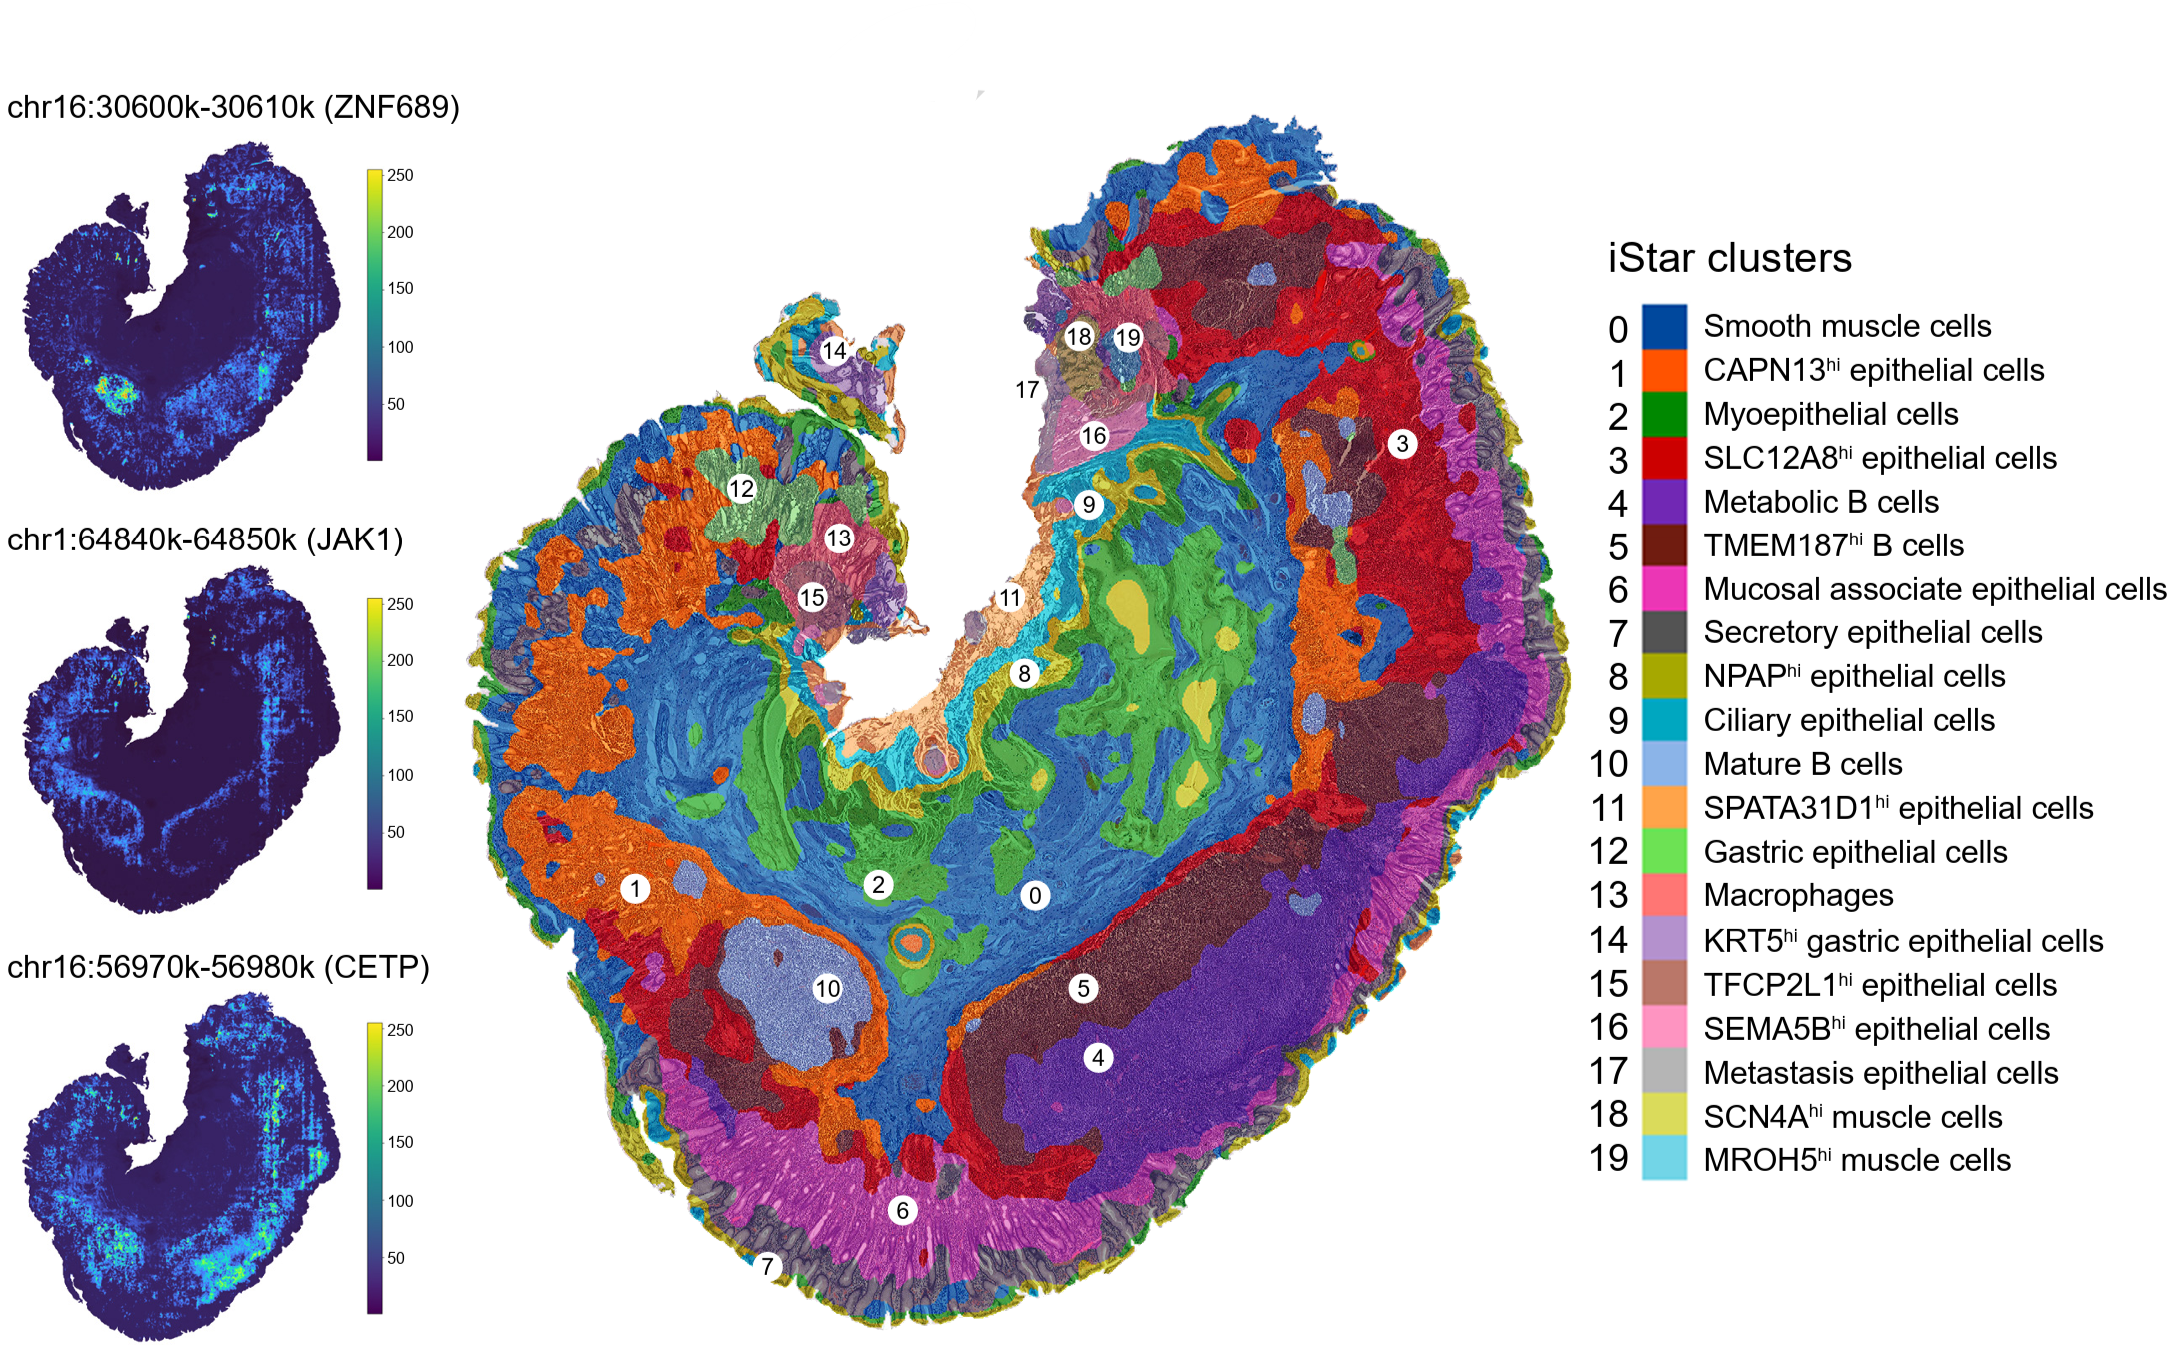
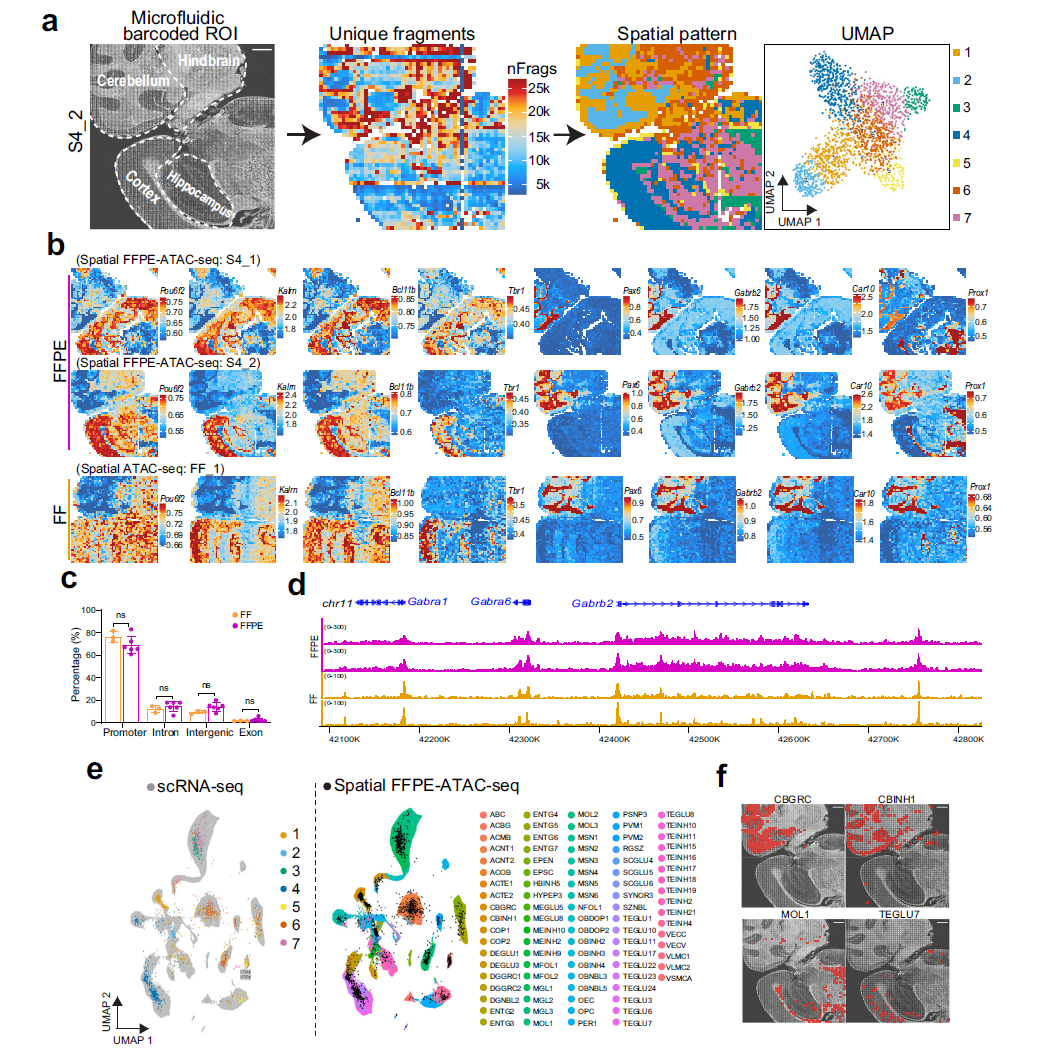

Select application studies across oncology, neurodegeneration, and sensory biology.
A curated set of studies applying spatial ATAC-seq to diverse biological questions — from tumor cell state plasticity to sex-linked epigenomic differences in human tissue.


